HockeyStack

G2
Hello G2! We built a special dashboard for you in HockeyStack.
Want to hear what it’s about? Let us explain...
Hello G2! We built a special dashboard for you in HockeyStack.
Want to hear what it’s about? Let us explain...
Connect all of your data sources in one place to uncover what’s driving revenue in marketing, map out buyer journeys, and empower your sales team with insights to close more deals.

Trusted by leading B2B businesses around the globe


Data silos, complicated BI tools, and manually wrangling data have prevented marketers from finding out what works and what’s doesn’t so they can GTM with confidence. Here’s how we’re changing that:

Integrate data from your entire tech stack: website, CRM, ad platforms, marketing automation, ABM platform, and data warehouse.
Automate data cleaning so it’s complete, up to date, standardized, and free of duplicate CRM objects or broken UTM parameters.
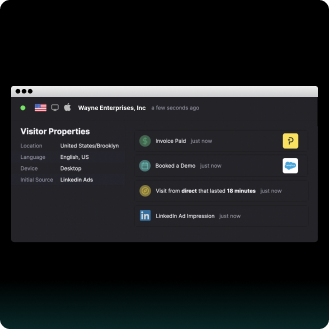
Collect website behavior and conversion events, from first touch to closed won, and turn it into a first-party dataset you can analyze.
.png)
— Cameron DeJong, Director of Marketing, RainTree

.png)

Map customer journeys and weight touchpoints with multi-touch, single-touch, and machine learning models trained on historical closed/won paths.
Use control groups vs. treatments groups to see which marketing touchpoints have the most incremental lift on a specified goal.
Measure the influence of hard-to-track brand and offline activity with the help of machine learning statistical algorithms.
dfg.png)
— Canberk Beker, Global Head of Paid, Cognism

Build custom KPIs, reports, and dashboards inside HockeyStack, in minutes, without complex BI tools.
Set pipeline and revenue goals, track pacing, and spot if you’re off-track (and by how much) before it’s too late.
Get granular with analysis by segmenting data and performance by product, price, region, or persona.
.png)
— Anand Nambiar, Head of Demand Gen, OneFlow
.png)
.png)

Forecast future marketing performance and align your GTM team around a revenue goal you know you can hit.
Identify inefficient spend across channels and allocate budget towards marketing you know drives revenue.
Feed outbound sales with high-intent leads scored by a predictive algorithm, not an arbitrary points system.
.png)
— Levi Olmstead, Director of Content, WhatFix
You don’t need another measurement point solution that just describes the past. You need answers to marketing’s most critical questions so you can also build the future.
.png)
.png)
.png)
.png)
.png)
.png)
Their words, not ours


The technical implementation takes a couple minutes. The onboarding process, including building initial dashboards, training, and adjusting takes 2 weeks on average.
Every column, metric, calculation, definition... basically, everything on HockeyStack is 100% customizable right through our easy-to-use UI.
Analytics platforms usually use cookies to track users. Use of cookies has recently come under scrutiny by privacy legislators, and have been severely restricted.
Everything you see here works without cookies by default. You still have the option to switch to cookie-based tracking. Read our article on our cookieless tracking technology to learn more.
Website activity is identified using form fills and existing identities from your backend. This is then matched to identities on all your other data sources using a matching key, most commonly their email address.
Contact us through email (hello@hockeystack.com) with your request and we will build it for you!
We store your data on AWS servers in Frankfurt, Germany. We don't collect any personal information by default, including IP addresses. We follow GDPR and CCPA regulations. Read our privacy policy to learn more.
